





성능 모니터링 지표
Mattermost v12.0요약
Mattermost는 Prometheus 및 Grafana와 통합하는 데 사용할 수 있는 다음 성능 모니터링 통계를 제공합니다. 다음은 시스템 성능을 모니터링하는 데 사용할 수 있는 커스텀 Mattermost 지표 목록입니다:
사용 가능 플랜: Entry, Enterprise, Enterprise Advanced(Professional 제외)
Mattermost는 Prometheus 및 Grafana와 통합하는 데 사용할 수 있는 다음 성능 모니터링 통계를 제공합니다.
커스텀 Mattermost 지표#
다음은 시스템 성능을 모니터링하는 데 사용할 수 있는 커스텀 Mattermost 지표 목록입니다:
API 지표#
mattermost_api_time: 주어진 API 핸들러를 실행하는 데 걸린 총 시간(초).
캐싱 지표#
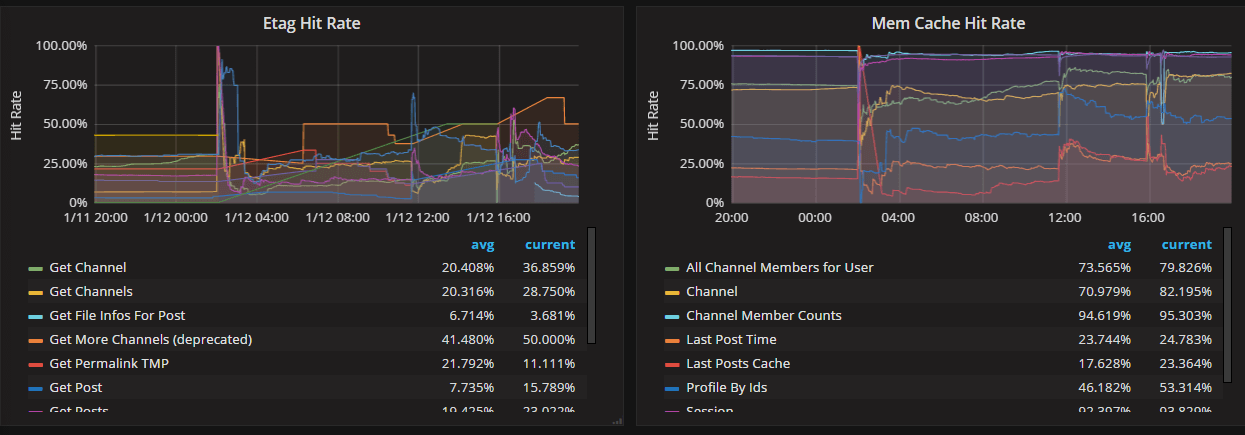
mattermost_cache_etag_hit_total: 특정 캐시에 대한 ETag 캐시 히트 총 횟수.mattermost_cache_etag_miss_total: API 호출에 대한 ETag 캐시 미스 총 횟수.mattermost_cache_mem_hit_total: 특정 캐시에 대한 메모리 캐시 히트 총 횟수.mattermost_cache_mem_invalidation_total: 특정 캐시에 대한 메모리 캐시 무효화 총 횟수.mattermost_cache_mem_miss_total: 특정 캐시에 대한 캐시 미스 총 횟수.
위 지표는 시간에 따른 ETag 및 메모리 캐시 히트율을 계산하는 데 사용할 수 있습니다.
클러스터 지표#
mattermost_cluster_cluster_request_duration_seconds: 노드 간 클러스터 요청의 총 소요 시간(초).mattermost_cluster_cluster_health_score: gossip 프로토콜의 소프트 실시간 요구사항을 얼마나 잘 충족하는지에 대한 점수.mattermost_cluster_cluster_requests_total: 노드 간 요청의 총 횟수.mattermost_cluster_cluster_event_type_totals: 모든 유형에 대해 전송된 클러스터 요청의 총 횟수.mattermost_cluster_reliable_fallback_tcp: 메시지 길이로 인해SendReliable(TCP)로 폴백해야 했던SendBestEffort(UDP) 호출의 총 길이(바이트). 이는 32KiB부터 4MiB까지 8개의 버킷을 가진 히스토그램입니다. 이상적으로 이 지표의 카운트는 항상 0이어야 하지만, 플러그인이 웹소켓 API를 잘못 사용하여 UDP를 통해 큰 메시지를 전송하려고 시도할 수 있습니다. 이 경우 플러그인이 ReliableClusterSend를 true로 설정하도록 수정해야 합니다.
데이터베이스 지표#
mattermost_db_active_users: 활성 사용자 총 수.mattermost_db_cache_time: 캐시 핸들러를 실행하는 시간.mattermost_db_master_connections_total: 마스터 데이터베이스에 대한 연결 총 횟수.mattermost_db_read_replica_connections_total: 모든 읽기 복제본 데이터베이스에 대한 연결 총 횟수.mattermost_db_search_replica_connections_total: 모든 검색 복제본 데이터베이스에 대한 연결 총 횟수.mattermost_db_store_time: 주어진 데이터베이스 저장 메서드를 실행하는 데 걸린 총 시간(초).mattermost_db_replica_lag_abs: binlog 거리/트랜잭션 큐 길이를 기반으로 한 절대 지연 시간.mattermost_db_replica_lag_time: 복제본이 따라잡는 데 걸리는 시간.
데이터베이스 연결 지표#
go_sql_max_open_connections: 데이터베이스에 대한 최대 열린 연결 수.go_sql_open_connections: 사용 중이거나 유휴 상태인 설정된 연결 수.go_sql_in_use_connections: 현재 사용 중인 연결 수.go_sql_idle_connections: 유휴 연결 수.go_sql_wait_count_total: 연결 대기 총 횟수.go_sql_wait_duration_seconds_total: 새 연결을 기다리며 차단된 총 시간.go_sql_max_idle_closed_total: SetMaxIdleConns로 인해 닫힌 연결 총 횟수.go_sql_max_idle_time_closed_total: SetConnMaxIdleTime으로 인해 닫힌 연결 총 횟수.go_sql_max_lifetime_closed_total: SetConnMaxLifetime으로 인해 닫힌 연결 총 횟수.
HTTP 지표#
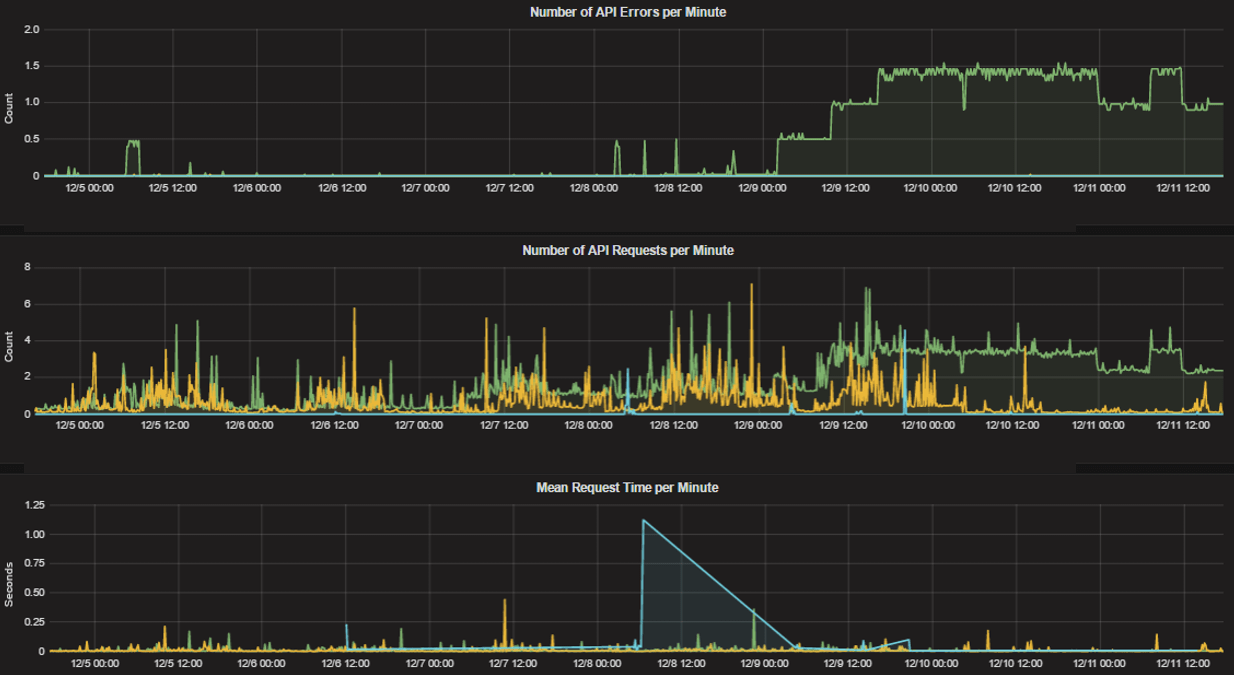
mattermost_http_errors_total: HTTP API 오류 총 횟수.mattermost_http_requests_total: HTTP API 요청 총 횟수.mattermost_http_websockets_total: 이 서버에 대한 웹소켓 연결 총 수.
Mattermost 버전 v9.9부터 이 값에는 인증되지 않은 잠재적 연결이 포함됩니다. 또한 이 지표에는 다양한 클라이언트 유형(예: 웹, 모바일, 데스크톱)의 연결 분포를 확인하는 데 사용할 수 있는 origin_client 레이블이 포함됩니다.
로그인 및 세션 지표#
mattermost_login_logins_fail_total: 실패한 로그인 총 횟수.mattermost_login_logins_total: 성공한 로그인 총 횟수.
Mattermost 채널 지표#
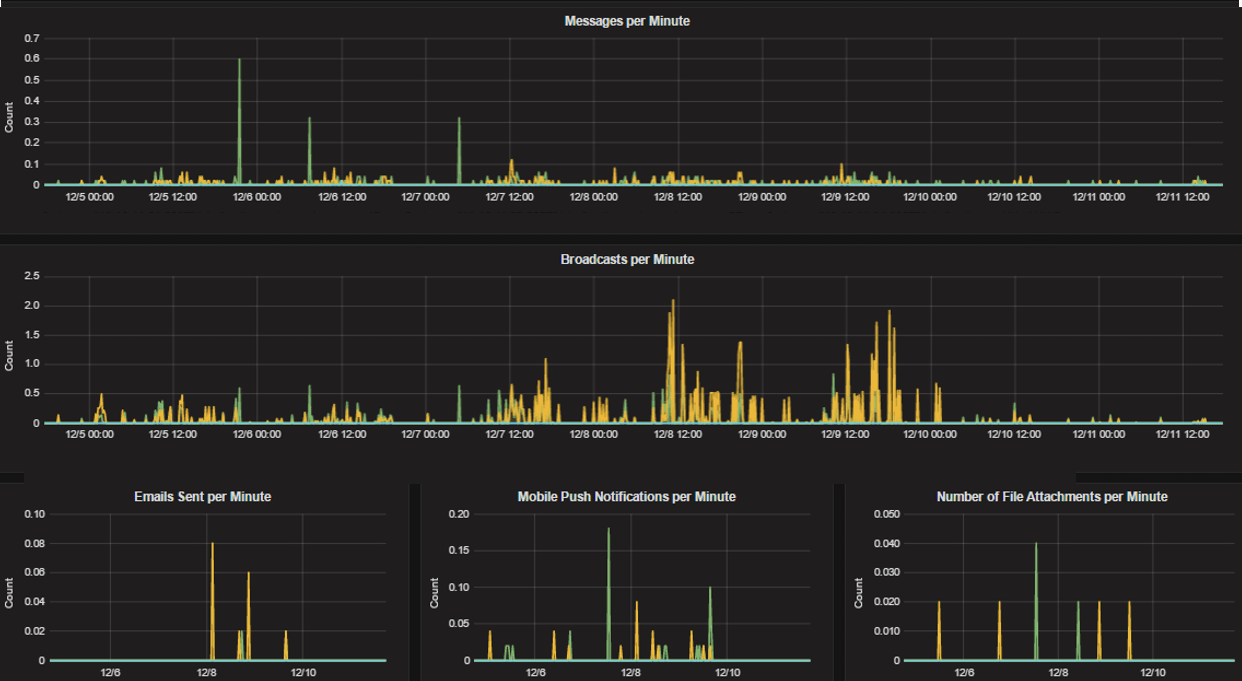
mattermost_post_broadcasts_total: 게시물이 생성되어 전송된 웹소켓 브로드캐스트 총 횟수.mattermost_post_emails_sent_total: 게시물이 생성되어 전송된 이메일 총 횟수.mattermost_post_file_attachments_total: 게시물이 생성되어 생성된 파일 첨부 총 횟수.mattermost_post_pushes_sent_total: 게시물이 생성되어 전송된 모바일 푸시 알림 총 횟수.mattermost_post_total: 생성된 게시물 총 수.mattermost_post_webhooks_total: 생성된 웹훅 게시물 총 수.
프로세스 지표#
mattermost_process_cpu_seconds_total: 초 단위로 사용된 총 사용자 및 시스템 CPU 시간.mattermost_process_max_fds: 최대 열린 파일 디스크립터 수.mattermost_process_open_fds: 열린 파일 디스크립터 수.mattermost_process_resident_memory_bytes: 상주 메모리 크기(바이트).mattermost_process_start_time_seconds: unix epoch 이후 프로세스 시작 시간(초).mattermost_process_virtual_memory_bytes: 가상 메모리 크기(바이트).mattermost_process_virtual_memory_max_bytes: 사용 가능한 최대 가상 메모리 양(바이트).
검색 지표#
mattermost_search_posts_searches_duration_seconds: 게시물 검색의 총 소요 시간(초).mattermost_search_channel_index_total: 수행된 채널 인덱스 총 횟수.mattermost_search_file_index_total: 수행된 파일 인덱스 총 횟수.mattermost_search_files_searches_duration_seconds: 파일 검색의 총 소요 시간(초).mattermost_search_files_searches_total: 수행된 파일 검색 총 횟수.mattermost_search_post_index_total: 수행된 게시물 인덱스 총 횟수.mattermost_search_posts_searches_total: 수행된 게시물 검색 총 횟수.mattermost_search_user_index_total: 수행된 사용자 인덱스 총 횟수.mattermost_search_engine_status: 구성된 검색 엔진의 상태:1= 정상 또는 구성되지 않음,0= 구성되었지만 사용 불가. 검색 엔진 중단에 대한 알림을 설정하는 데 이 지표를 사용하세요.
WebSocket 지표#
mattermost_websocket_broadcast_buffer_size: 처리 대기 중인 웹소켓 브로드캐스트 버퍼의 이벤트 수.mattermost_websocket_broadcast_buffer_users_registered: 브로드캐스트 버퍼 허브에 등록된 사용자 수.mattermost_websocket_broadcasts_total: 모든 유형에 대해 전송된 웹소켓 브로드캐스트 총 횟수.mattermost_websocket_event_total: 웹소켓 이벤트 총 수.mattermost_websocket_reconnects_total: 웹소켓 재연결 시도 총 횟수.
로깅 지표#
mattermost_logging_logger_queue_used: 로그 대상 큐의 레코드 수.mattermost_logging_logger_logged_total: 기록된 레코드 총 수.mattermost_logging_logger_error_total: 로거 오류 총 수.mattermost_logging_logger_dropped_total: 삭제된 로그 레코드 총 수.mattermost_logging_logger_blocked_total: 차단/지연된 로그 레코드 총 수.
디버깅 지표 - 시스템#
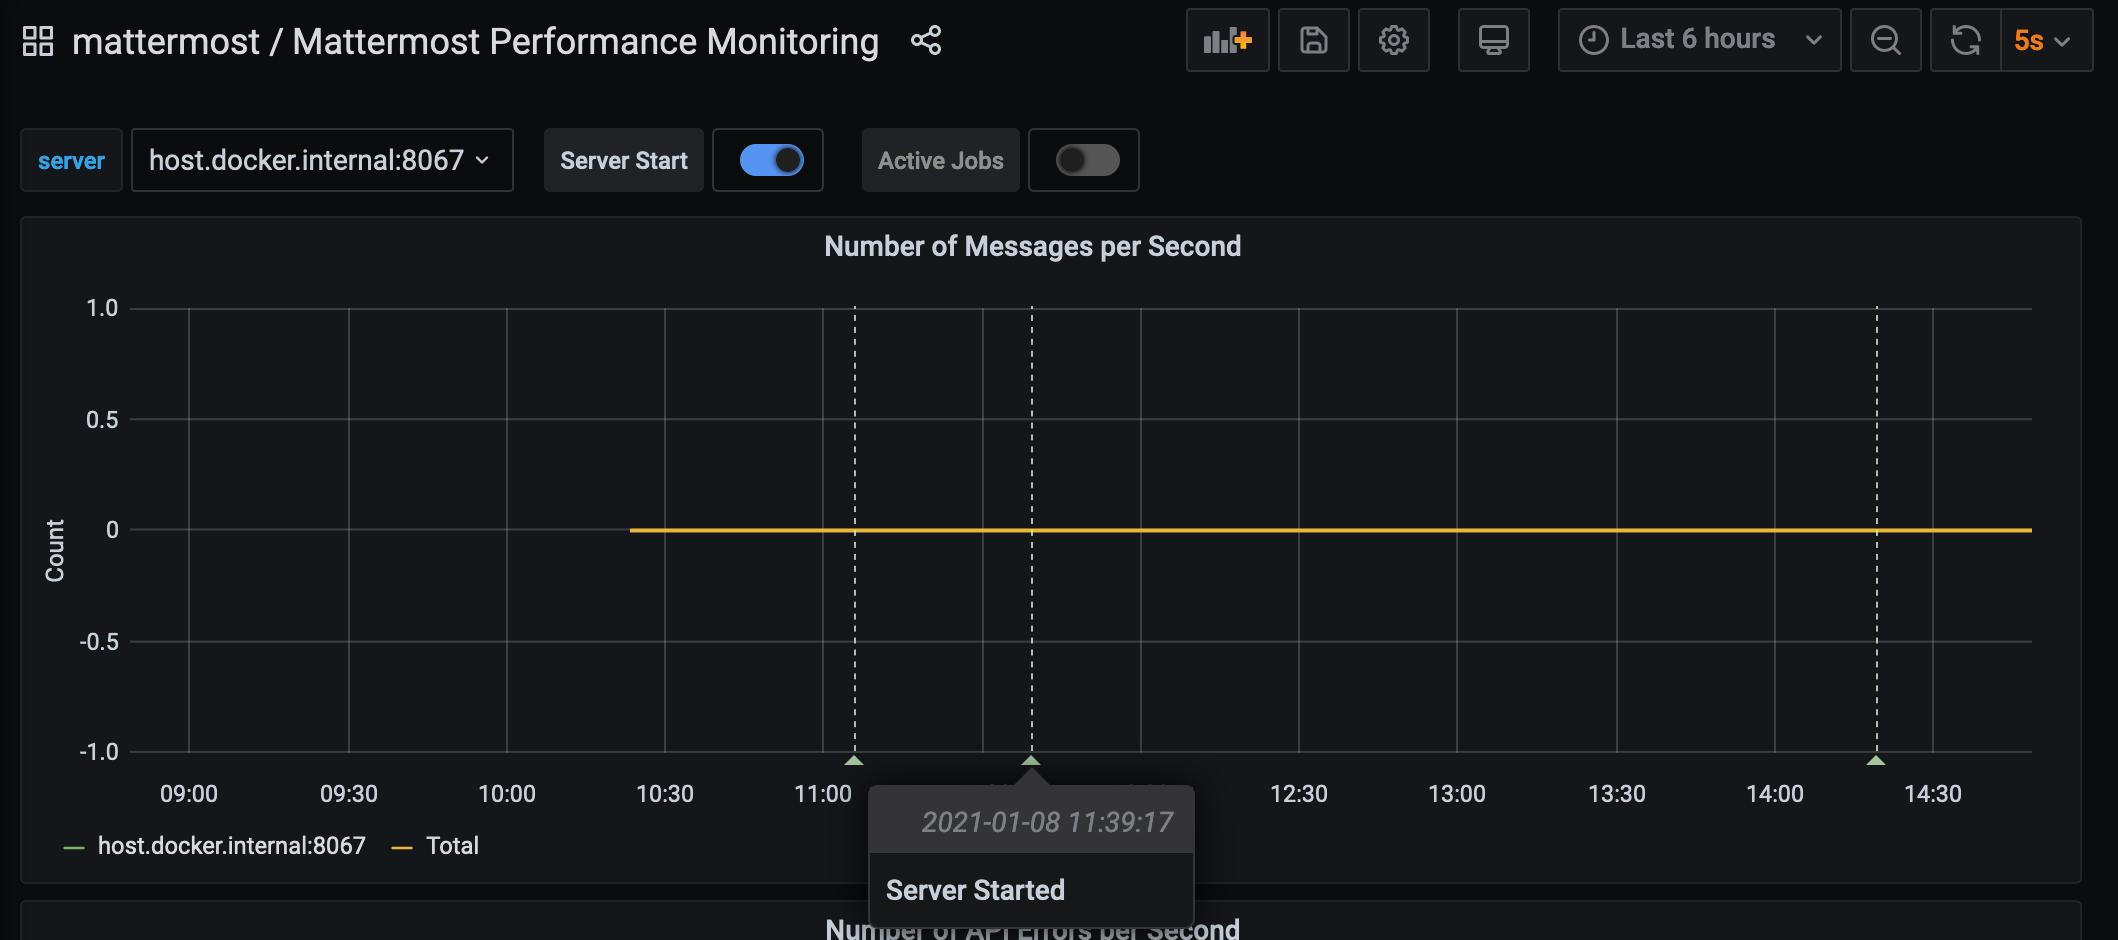
mattermost_system_server_start_time: 서버가 시작된 시간.
mattermost_system_server_start_time을 사용하여 이벤트에 해당하는 주석을 동적으로 추가하세요.
디버깅 지표 - 작업#
mattermost_jobs_active: 활성 작업 수.
mattermost_jobs_active를 사용하여 활성 작업 차트를 표시하세요.
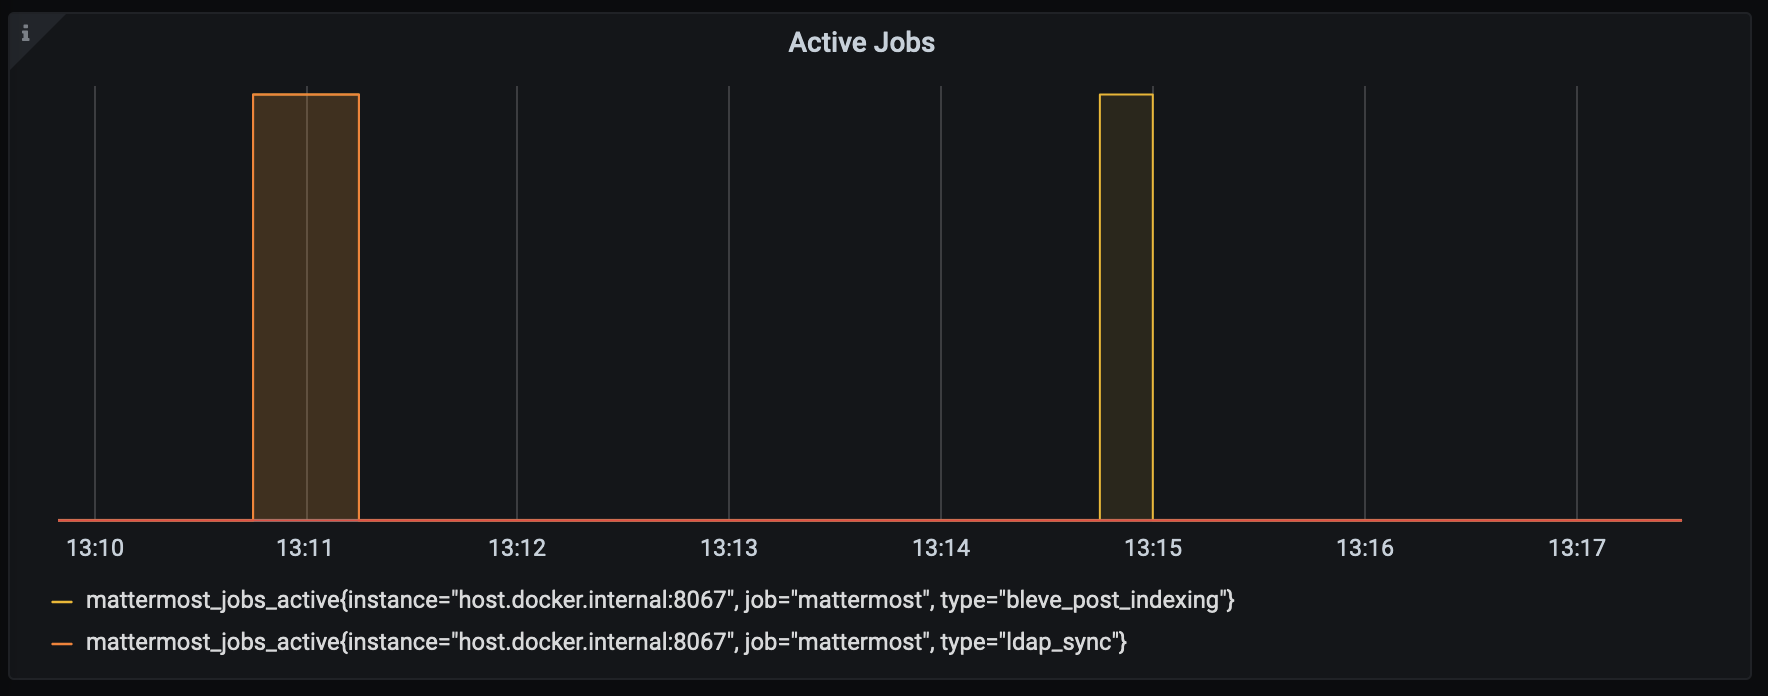
또는 mattermost_jobs_active를 사용하여 작업이 활성 상태인 동안 범위 주석을 동적으로 추가하세요.
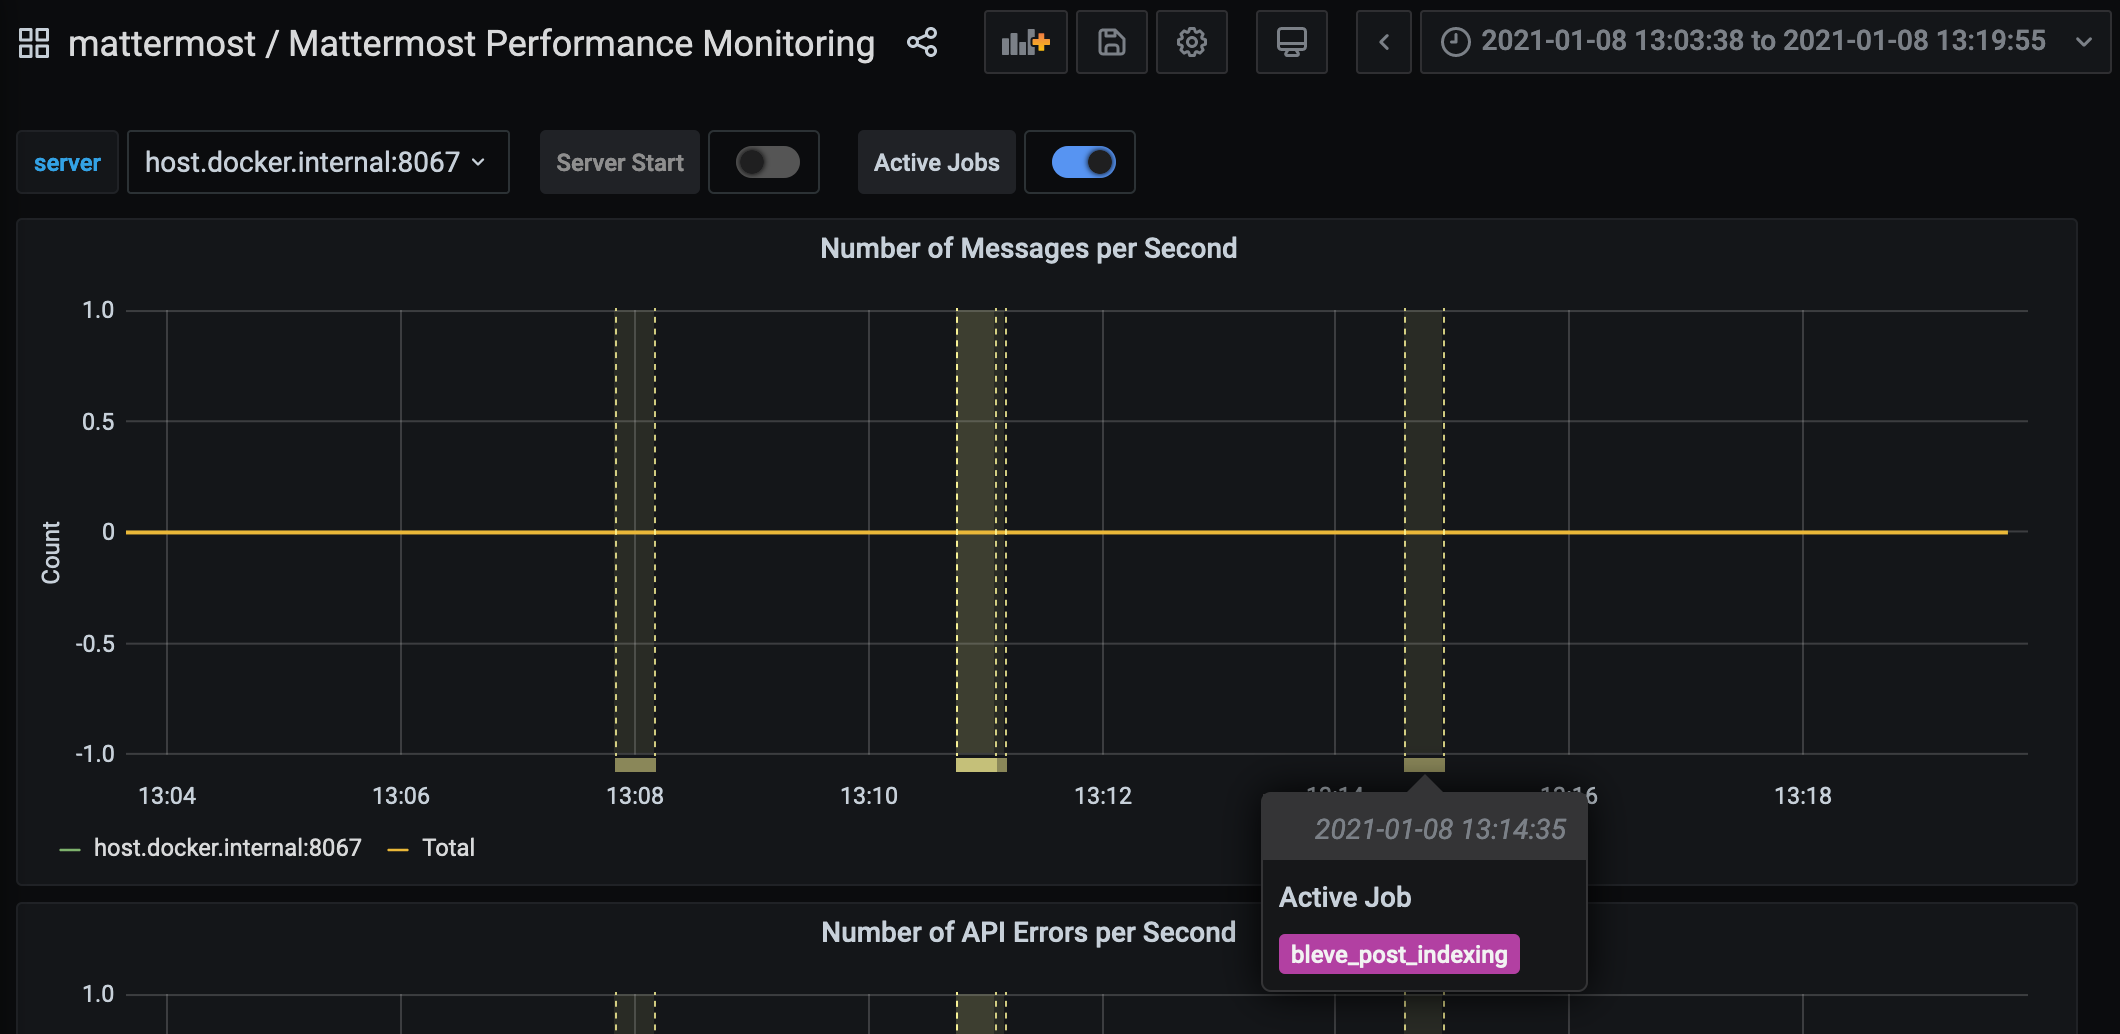
LDAP 동기화 작업과 같이 장시간 실행되는 작업을 분석할 때 주석을 사용하면 분석이 간소화됩니다.
런타임이 Prometheus 폴링 간격보다 짧은 작업은 Grafana가 원시 Prometheus 타임시리즈 데이터에 대해 범위 쿼리를 수행하고 값이 변경될 때마다 이벤트를 렌더링하기 때문에 표시되지 않을 가능성이 높습니다.
플러그인 지표#
mattermost_plugin_api_time: 플러그인 API 핸들러를 실행하는 시간(초).mattermost_plugin_hook_time: 플러그인 훅 핸들러를 실행하는 시간(초).mattermost_plugin_multi_hook_server_time: 서버가 여러 플러그인 훅 핸들러를 실행하는 시간(초).mattermost_plugin_multi_hook_time: 여러 플러그인 훅 핸들러를 실행하는 시간(초).
위 지표는 Mattermost 서버가 플러그인 코드를 실행하는 동안 측정합니다. Mattermost v11.8.0부터 AggregatePluginMetrics 기능 플래그가 활성화된 경우, 플러그인이 제공하는 Prometheus 지표도 표준 Mattermost /metrics 엔드포인트를 통해 노출될 수 있습니다. 집계된 플러그인 지표에는 플러그인의 매니페스트 ID를 기반으로 한 plugin_id 레이블이 포함되어 있어, 관리자가 각 지표를 생성한 플러그인을 식별할 수 있습니다.
AggregatePluginMetrics는 기본적으로 비활성화되어 있으며, 플러그인이 제공하는 지표를 /metrics 응답에 포함하려면 먼저 활성화해야 합니다.
공유 채널 지표#
mattermost_shared_channels_sync_collection_duration_seconds: 작업이 동기화 데이터를 수집하는 데 걸리는 시간(초).mattermost_shared_channels_sync_collection_step_duration_seconds: 작업이 데이터 수집의 각 단계에 걸리는 시간(초).mattermost_shared_channels_sync_count: 각 원격에 대해 처리된 동기화 이벤트 수.mattermost_shared_channels_sync_send_duration_seconds: 작업이 동기화 데이터를 전송하는 데 걸리는 시간(초).mattermost_shared_channels_sync_send_step_duration_seconds: 작업이 데이터 전송의 각 단계에 걸리는 시간(초).mattermost_shared_channels_task_in_queue_duration_seconds: 작업이 큐에서 대기하는 시간(초).mattermost_shared_channels_task_queue_size: 큐에 있는 현재 작업 수.
원격 클러스터 지표#
mattermost_remote_cluster_clock_skew: 클러스터 간 클럭 편차의 근사값.mattermost_remote_cluster_conn_state_change_total: 연결 상태 변경 총 횟수.mattermost_remote_cluster_msg_errors_total: 메시지 오류 총 횟수.mattermost_remote_cluster_msg_received_total: 원격 클러스터에서 수신된 메시지 총 횟수.mattermost_remote_cluster_msg_sent_total: 원격 클러스터로 전송된 메시지 총 횟수.mattermost_remote_cluster_ping_time: 원격 클러스터로의 핑 왕복 시간.
알림 지표#
mattermost_notifications_error: 알림 흐름을 중단시키는 오류 총 수.mattermost_notifications_not_sent: 시스템이 의도적으로 전송하지 않은 알림 총 수.mattermost_notifications_success: 성공적으로 전송된 알림 총 수.mattermost_notifications_total: 알림 이벤트 총 수.mattermost_notifications_total_ack: 승인된 알림 이벤트 총 수.mattermost_notifications_unsupported: 지원되지 않는 앱 버전으로 인해 추적 불가능한 알림 총 수.
모바일 앱 지표#
mattermost_mobileapp_mobile_channel_switch: 사용자가 채널 이름을 클릭한 시점부터 전체 채널 화면이 로드될 때까지의 시간(초).mattermost_mobileapp_mobile_load: 사용자가 앱을 열고 앱이 최종적으로 모든 관련 정보를 로드할 때까지의 시간(초).mattermost_mobileapp_mobile_team_switch: 사용자가 팀을 클릭한 시점부터 전체 카테고리 화면이 로드될 때까지의 시간(초).
웹 앱 지표#
mattermost_webapp_channel_switch: 사용자가 LHS에서 채널을 클릭한 시점부터 해당 채널의 게시물이 표시될 때까지의 시간(초).mattermost_webapp_cumulative_layout_shift: 페이지 콘텐츠가 예기치 않게 이동하는 정도.mattermost_webapp_first_contentful_paint: 사용자에게 화면에 콘텐츠가 표시되는 데 걸리는 시간(초).mattermost_webapp_global_threads_load: 사용자가 LHS에서 스레드를 열기 위해 클릭한 시점부터 전체 스레드 뷰가 표시될 때까지의 시간(밀리초).mattermost_webapp_interaction_to_next_paint: 사용자가 마우스로 클릭하거나 터치스크린으로 탭하거나 키보드 키를 누른 후 효과가 표시되는 데 걸리는 시간(초).mattermost_webapp_largest_contentful_paint: 사용자에게 화면에 대형 콘텐츠가 표시되는 데 걸리는 시간(초).mattermost_webapp_long_tasks: 브라우저의 메인 UI 스레드가 단일 작업으로 50ms 이상 차단된 횟수.mattermost_webapp_page_load: 브라우저가 웹 앱 로드를 시작한 시점부터 웹 앱의 load 이벤트가 완료될 때까지의 시간(초).mattermost_webapp_rhs_load: 사용자가 RHS에서 스레드를 열기 위해 클릭한 시점부터 해당 스레드의 게시물이 표시될 때까지의 시간(초).mattermost_webapp_team_switch: 사용자가 LHS에서 팀을 클릭한 시점부터 해당 팀의 게시물이 표시될 때까지의 시간(초).mattermost_webapp_time_to_first_byte: 브라우저가 서버에 페이지를 요청하기 시작한 시점부터 응답 데이터를 수신하기 시작할 때까지의 시간(초).
표준 Go 지표#
사용 가능 플랜: Entry, Professional, Enterprise, Enterprise Advanced
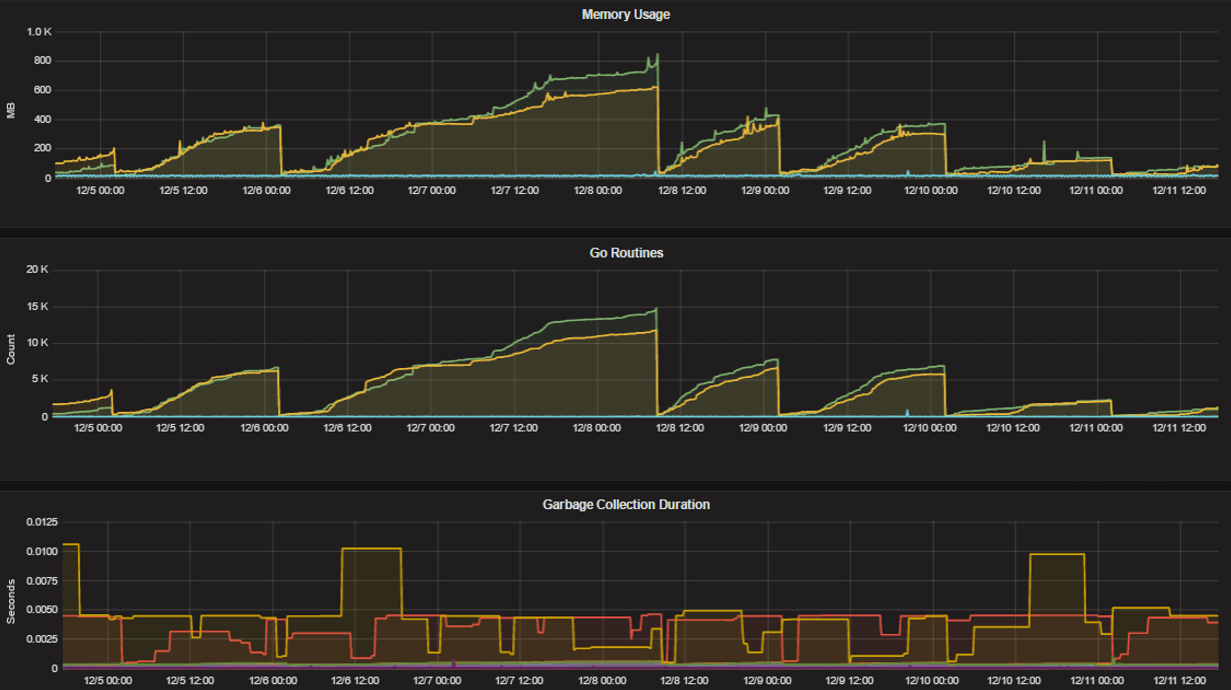
성능 모니터링 기능은 HTTP 서버 런타임 프로파일링 데이터 및 시스템 모니터링을 위한 표준 Go 지표를 제공합니다. 예:
- 메모리 사용량을 위한
go_memstats_alloc_bytes - 고루틴 수를 위한
go_goroutines - 가비지 컬렉션 지속 시간을 위한
go_gc_duration_seconds - 힙에서 객체 추적을 위한
go_memstats_heap_objects
런타임 프로파일링 설정 방법은 pprof 패키지 Go 문서를 참조하세요. 또한 ip:port 페이지에서 설명과 함께 전체 지표 목록을 확인할 수 있습니다.
HTTP를 사용하여 /metrics에 연결하려면 Mattermost Enterprise 라이선스가 필요합니다.
활성화된 경우 다음 명령으로 프로파일러를 실행할 수 있습니다:
go tool pprof http://localhost:<port>/debug/pprof/profile?seconds=<duration>
localhost를 서버 이름으로 대체할 수 있습니다. 프로파일링 리포트는 <ip>:<port>에서 확인할 수 있으며 다음이 포함됩니다:
- CPU 프로파일링을 위한
/debug/pprof/profile?seconds=30 - 명령줄 프로파일링을 위한
/debug/pprof/cmdline - 심볼 프로파일링을 위한
/debug/pprof/symbol - 추적 프로파일링을 위한
/debug/pprof/trace - Go 루틴 프로파일링을 위한
/debug/pprof/goroutine - 힙 프로파일링을 위한
/debug/pprof/heap - 스레드 프로파일링을 위한
/debug/pprof/threadcreate - 블록 프로파일링을 위한
/debug/pprof/block - 과거 메모리 할당을 위한
/debug/pprof/allocs - 경합이 심한 뮤텍스 보유자의 로그를 위한
/debug/pprof/mutex
호스트/시스템 지표#
Metrics Plugin v0.7.0부터 node exporter 대상에서 지표를 가져와 Mattermost Calls의 네트워크 관련 패널에 접근할 수 있습니다.
자주 묻는 질문#
차트 레이블을 구별하기 어려운 이유는 무엇입니까?#
서버 필터 및 범례에서 사용되는 차트 레이블은 머신의 호스트명을 기반으로 합니다. 호스트명이 유사하면 레이블을 구별하기 어렵습니다.
머신에 더 설명적인 호스트명을 설정하거나 Prometheus 구성의 relabel_config로 표시 이름을 변경할 수 있습니다.